The graphs below are normal probability plots of the vocabulary and math concept
scores on a standardized exam for a large sample of students. One of the score
distributions is approximately normal. Identify the score distribution that is
approximately normal and explain the reason for your choice. 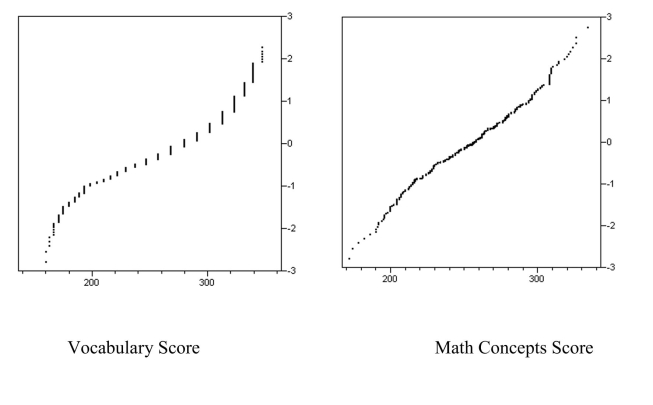
Correct Answer:
Verified
View Answer
Unlock this answer now
Get Access to more Verified Answers free of charge
Q11: One theory of why birds form in
Q16: What information about a probability distribution do
Q22: Electric power cords are a common hazard
Q24: The number of copies sold of
Q25: Let z denote a random variable
Q27: At the University of Tough Love,
Q29: Each course at a large university
Q30: A state-wide math test consists of
Q31: A gasoline tank for a certain model
Q45: Determine the following areas under the standard
Unlock this Answer For Free Now!
View this answer and more for free by performing one of the following actions

Scan the QR code to install the App and get 2 free unlocks

Unlock quizzes for free by uploading documents