Multiple Choice
Given the normal distribution curve shown in the figure below, find the area under the curve between and . Use the data found in Table E of Appendix
C.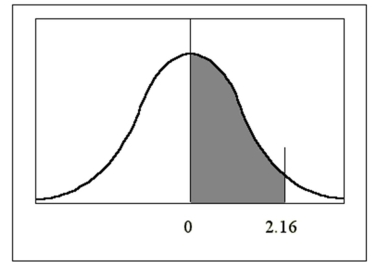
A) 0.4788
B) 0.4821
C) .4955
D) 0.4846
Correct Answer:
Verified
Related Questions

