The accompanying figure shows the graph of y = x2 shifted to a new position. Write the equation for the new graph. 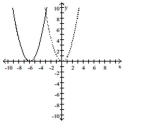
A)
B)
C)
D)
Correct Answer:
Verified
Q97: Provide an appropriate response.
-For what values
Q98: Find the domain and range for
Q99: Find the domain and range for
Q100: Find the domain and range for the
Q101: Find the domain and range for
Q103: Express the given function as a
Q104: Find the domain and range for
Q105: Find the domain and range for
Q106: Express the given function as a
Q107: The accompanying figure shows the graph
Unlock this Answer For Free Now!
View this answer and more for free by performing one of the following actions

Scan the QR code to install the App and get 2 free unlocks

Unlock quizzes for free by uploading documents