Use the table to estimate the rate of change of y at the specified value of x.
-When exposed to ethylene gas, green bananas will ripen at an accelerated rate. The number of days for ripening becomes shorter for longer exposure times. Assume that the table below gives average ripening times of
Bananas for several different ethylene exposure times. 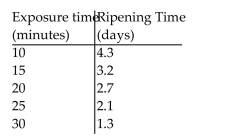 Plot the data and then find a line approximating the data. With the aid of this line, determine the rate of change of Ripening time with respect to exposure time. Round your answer to two significant digits.
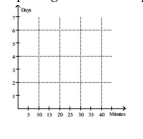
A) 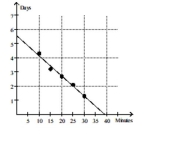
days per minute
B) 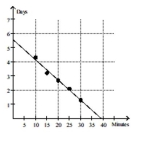
days
C) 
38 minutes
D) 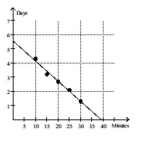
-0.14 day per minute
Correct Answer:
Verified
Q32: The graph below shows the number of
Q33: Q34: Use the graph to evaluate the Q35: Use the graph to evaluate the Q36: Q38: Find the limit. Q39: Use the graph to evaluate the Q40: Find the limit. Q41: Find the limit, if it exists. Q42: Find the limit if it exists. Unlock this Answer For Free Now! View this answer and more for free by performing one of the following actions Scan the QR code to install the App and get 2 free unlocks Unlock quizzes for free by uploading documents
-
-
-
-

