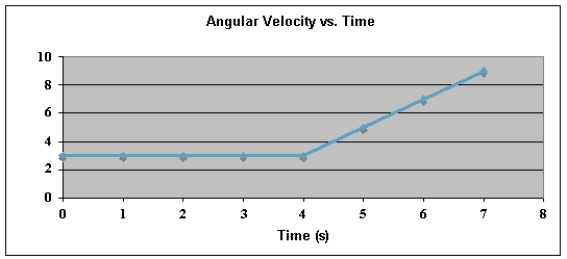
The graph below shows a plot of angular velocity in rad/s versus time in s from t = 0 s to t = 7 s.
Use this exhibit to answer the following question(s) .
-The angular position, θ, at t = 0 s is 3.0 rad, clockwise. The angular position, θ, at t = 7 s is
A) 27 rad, CW.
B) 27 rad, CCW.
C) 33 rad, CW.
D) 33 rad, CCW.
E) 36 rad, CCW.
Correct Answer:
Verified
Q52: The angular speed of the hour hand
Q53:
The figure below shows a graph of
Q54:
The figure below shows a graph of
Q56:
The graph below shows a plot of
Q58: Exhibit 12-2
The figure below shows a graph
Q59: The angular speed of the hour hand
Q61: Two vectors lying in the xy plane
Q62: A rod of length 1.00 m has
Q66: A small sphere attached to a light
Q76: A rigid rod of length l rotates
Unlock this Answer For Free Now!
View this answer and more for free by performing one of the following actions

Scan the QR code to install the App and get 2 free unlocks

Unlock quizzes for free by uploading documents