The figure below shows a sine wave at one point of a string as a function of time.
Use the exhibit to answer the following question(s) .
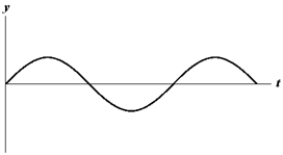
-Which of the graphs below shows a wave where the amplitude and frequency are each reduced in half?
A) 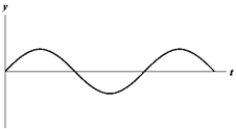
B) 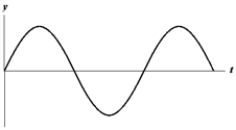
C) 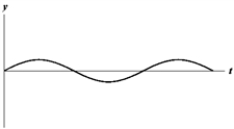
D) 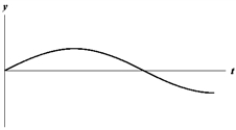
E) 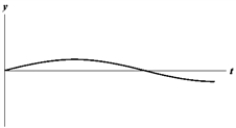
Correct Answer:
Verified
Q21: The wave equation is written down in
Q21: To transmit four times as much energy
Q22:
Four wave functions are given below.
I.y(x, t)
Q25: A student attaches a length of nylon
Q29: Suppose that you were selected for a
Q29: Ariel claims that a pulse is described
Q30:
The figure below shows a sine wave
Q34: Earthquake waves are classified as P waves
Q38: A piano wire of length 1.5 m
Q39: You are holding on to one end
Unlock this Answer For Free Now!
View this answer and more for free by performing one of the following actions

Scan the QR code to install the App and get 2 free unlocks

Unlock quizzes for free by uploading documents