The graph below shows the velocity versus time graph for a ball. Which explanation best fits the motion of the ball as shown by the graph? 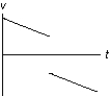
A) The ball is falling, is caught, and is thrown down with greater velocity.
B) The ball is rolling, stops, and then continues rolling.
C) The ball is rising, hits the ceiling, and falls down.
D) The ball is falling, hits the floor, and bounces up.
E) The ball is rising, is caught, and then is thrown down.
Correct Answer:
Verified
Q29: When Jim and Rob ride bicycles, Jim
Q30: The speed of an object is
Q31: Two children start at one end of
Q32: A particle moving along the x axis
Q33: To help Kim practice for the Paralympics,
Q34: Two identical balls are at rest and
Q36: The equation that solves a problem
Q37: The position of a particle moving
Q38: A boy on a skate board skates
Q39: In 20 minutes, Lucy ran 2.40 km
Unlock this Answer For Free Now!
View this answer and more for free by performing one of the following actions

Scan the QR code to install the App and get 2 free unlocks

Unlock quizzes for free by uploading documents