The graph below shows a plot of angular acceleration in rad/s2 versus time from t = 0 s to t = 8 s. The change in angular velocity, , during this 8-second period is: 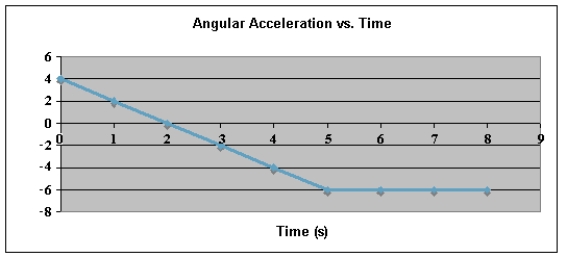
A) , CW.
B) , CCW.
C) , CW.
D) , CCW.
E) , CW.
Correct Answer:
Verified
Q29: Refer to Exhibit 9-1 below.Exhibit 9-1
Q30: Refer to Exhibit 9-1 below.Exhibit 9-1 The
Q31: A uniform rod of mass M
Q32: The graphs below show angular velocity as
Q33: Refer to Exhibit 9-1 below.Exhibit 9-1
Q36: Which of the following diagrams shows the
Q37: A uniform sphere of radius R
Q38: A uniform metre stick is pivoted to
Q39: Refer to Exhibit 9-1 below.Exhibit 9-1 The
Q67: A small sphere attached to a light
Unlock this Answer For Free Now!
View this answer and more for free by performing one of the following actions

Scan the QR code to install the App and get 2 free unlocks

Unlock quizzes for free by uploading documents