Use the graphs below to answer the following questions. 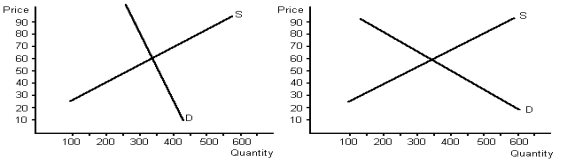
a.Determine equilibrium price and quantity for each graph.
b.Given demand and supply, what would total revenue be for each graph?
c.Assume that supply shifts to the left on both graphs by 100, raising price.Given the new equilibrium price and equilibrium quantity, what would total revenue be for each graph?
d.What do your answers to part c tell you about the relationship between elasticity of demand and total revenue?
Correct Answer:
Verified
View Answer
Unlock this answer now
Get Access to more Verified Answers free of charge
Q147: What is elasticity and why do economists
Q148: The price of product X is reduced
Q149: If two demand curves with different slopes
Q150: Suppose a demand function yields an equilibrium
Unlock this Answer For Free Now!
View this answer and more for free by performing one of the following actions

Scan the QR code to install the App and get 2 free unlocks

Unlock quizzes for free by uploading documents