Multiple Choice
Graph 8-2 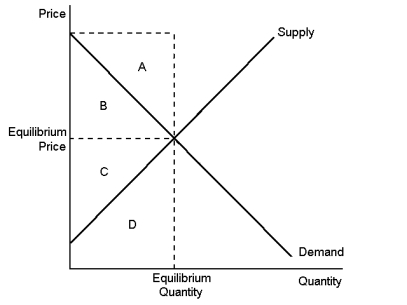 This graph shows supply and demand in a free market.
-According to Graph 8-2, when the market is in equilibrium, producer surplus is represented by area:
A) A
B) B
C) C
D) D
Correct Answer:
Verified
Related Questions
Graph 8-2 This graph shows supply and demand in a free market.
-According to Graph 8-2, when the market is in equilibrium, producer surplus is represented by area:
A) A
B) B
C) C
D) D
Correct Answer:
Verified

