Graph 9-2
This graph refers to the market for saddles in Argentina. 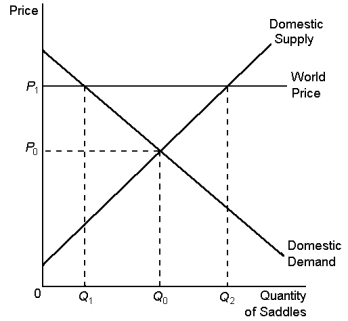
-According to Graph 9-2, the price and quantity demanded of saddles in Argentina after trade would be:
A) P₁, Q₂
B) P₁, Q₁
C) P₀, q₀
D) P₀, Q₁
Correct Answer:
Verified
Q85: Graph 9-2
This graph refers to the market
Q86: Graph 9-3 Q87: Graph 9-4 Q88: Graph 9-6 Q89: Which one of the According to Graph Q91: Graph 9-4 Q92: Graph 9-5 Q93: Graph 9-4 Q94: Graph 9-3 Q95: Graph 9-4![]()
This graph refers to the market
This graph refers to the market
This graph refers to the market
This graph refers to the market
This graph refers to the market![]()
This graph refers to the market
Unlock this Answer For Free Now!
View this answer and more for free by performing one of the following actions

Scan the QR code to install the App and get 2 free unlocks

Unlock quizzes for free by uploading documents