Multiple Choice
Graph 10-5 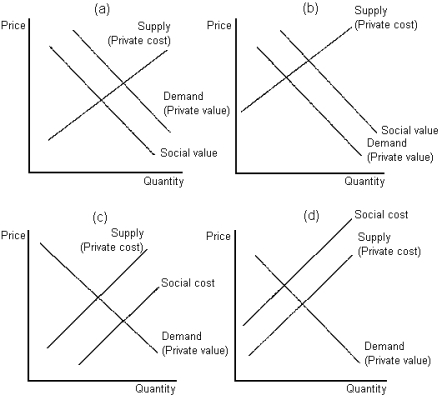
-Refer to Graph 10-5.In the figure shown, which set of graphs depict a situation most likely to benefit from a Pigovian tax?
A) panels (a) and (c)
B) panels (b) and (d)
C) panels (b) and (c)
D) panels (a) and (d)
Correct Answer:
Verified
Related Questions
Q159: When the government reverts to command-and-control policy
Q160: Pigovian taxes are typically advocated to correct
Q161: In some cases, pollution permits may be
Unlock this Answer For Free Now!
View this answer and more for free by performing one of the following actions

Scan the QR code to install the App and get 2 free unlocks

Unlock quizzes for free by uploading documents