Graph 10-2 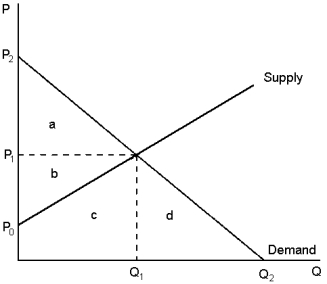 This graph depicts the market for pork.Use this information to answer the following question(s) .
-In Graph 10-2, what price and quantity combination efficiently allocates resources in such a way that the total value to consumers who buy and use pork minus the total costs to the producers who make and sell pork is maximised?
A) P₁, Q₁
B) P₂, quantity of zero
C) price of zero, Q₂
D) P₀, Q₂
Correct Answer:
Verified
Q56: Airports can generate a negative externality with
Q57: Inventors in developing countries are usually unable
Q58: When Jake takes into account how his
Q59: A positive externality exists when:
A)a person engages
Q60: Brent and Jess live together.Every morning, Jess
Q62: A ???_ is enacted to correct the
Unlock this Answer For Free Now!
View this answer and more for free by performing one of the following actions

Scan the QR code to install the App and get 2 free unlocks

Unlock quizzes for free by uploading documents