Graph 13-6 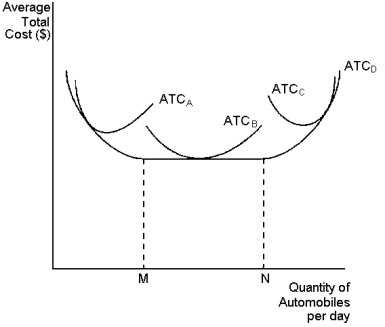 This graph depicts average total cost functions for a firm that produces automobiles.Use the graph to answer the following question(s) .
-Refer to Graph 13-6.In the long run, the firm can operate on which of the following average total cost curves?
A) ATCA
B) ATCB
C) ATCC
D) any of the above
Correct Answer:
Verified
Q135: Graph 13-6 Q136: Graph 13-6 Q137: Graph 13-4 Q138: When a factory is operating in the Q139: At all levels of production beyond the Q141: Economies of scale occur when: Q142: Economies of scale arise when: Q143: Table 13-2 Q144: Constant returns to scale occur when: Q145: Table 13-1 Unlock this Answer For Free Now! View this answer and more for free by performing one of the following actions Scan the QR code to install the App and get 2 free unlocks Unlock quizzes for free by uploading documents![]()
![]()
![]()
A)long-run average total
A)workers are able
Adrienne's Premium Boxing Service subcontracts with
A)long-run average
Measures of Cost for Splashy Cardboard

