Graph 13-1 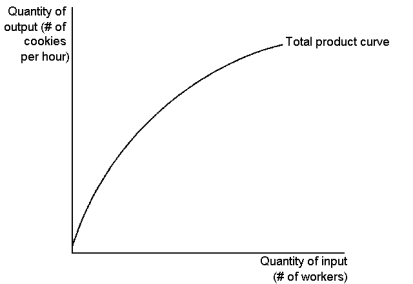 This graph depicts a production function for a firm that produces cookies.Use the
graph to answer the following question(s) .
-Refer to Graph 13-1.As the number of workers increases:
A) total output increases, but at a decreasing rate
B) marginal product increases but at a decreasing rate
C) marginal product increases
D) total output decreases
Correct Answer:
Verified
Q58: Which of the following would be categorised
Q59: The law of supply states that:
A)the supply
Q60: The relationship between the quantity of inputs
Q61: An important implicit cost of almost every
Q62: Accounting profit is equal to which of
Q64: The amount of money that an orchardist
Q65: From a firm's costs perspective, the long
Unlock this Answer For Free Now!
View this answer and more for free by performing one of the following actions

Scan the QR code to install the App and get 2 free unlocks

Unlock quizzes for free by uploading documents