Graph 15-4 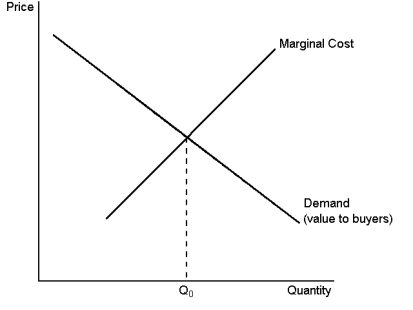 This graph depicts the demand and marginal-cost curves of a profit-maximising monopolist.Use the graph to answer the following question(s) .
-Refer to Graph 15-4.If the monopoly operates at an output level below q₀, decreasing output would:
A) raise the price and raise total surplus
B) lower the price and raise total surplus
C) raise the price and lower total surplus
D) lower the price and lower total surplus
Correct Answer:
Verified
Q174: Graph 15-4 Q175: Suppose a drug patent runs out, the Q176: Compared to the output in a competitive Q177: The extra profit that a monopoly makes Q178: A monopoly generates inefficiency because: Q180: Monopoly firms can employ their market power Q181: Total economic loss due to monopoly pricing![]()
A)the high prices
Unlock this Answer For Free Now!
View this answer and more for free by performing one of the following actions

Scan the QR code to install the App and get 2 free unlocks

Unlock quizzes for free by uploading documents