For Questions use the following narrative:
Narrative: Average hourly earnings
The graph below, done in 1998 by the Bureau of Labor Statistics, represents the average hourly earnings of U.S.workers from 1947-1998 (in 1998 dollars).
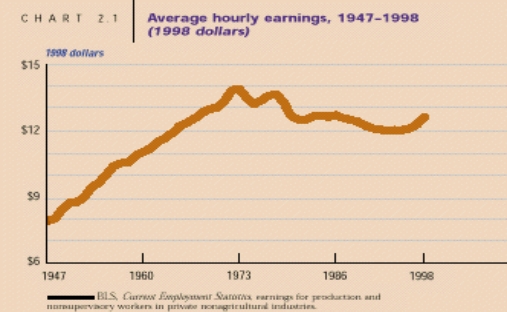
-{Average hourly earnings narrative} The designers of this graph expressed all their data in terms of 1998 dollars.Explain why they did this, and whether or not you think this is a good idea.
Correct Answer:
Verified
View Answer
Unlock this answer now
Get Access to more Verified Answers free of charge
Q38: Which of the following describes the result
Q39: Name two questions you should ask to
Q40: A(n) _ is a good way to
Q41: A statistical picture isn't worth much if
Q42: What is wrong with the following histogram?
SHAPE
Q44: In what way(s) can a poorly done
Q45: For Questions use the following narrative
Narrative: Pick
Q46: In what way(s) can a poorly done
Q47: For Questions use the following narrative:
Narrative: Average
Q48: Name 3 of the 12 questions you
Unlock this Answer For Free Now!
View this answer and more for free by performing one of the following actions

Scan the QR code to install the App and get 2 free unlocks

Unlock quizzes for free by uploading documents