TABLE 12-8
It is believed that GPA (grade point average, based on a four-point scale) should have a positive linear relationship with ACT scores. Given below is the Microsoft Excel output for predicting GPA using ACT scores based a data set of eight randomly chosen students from a Big Ten university.
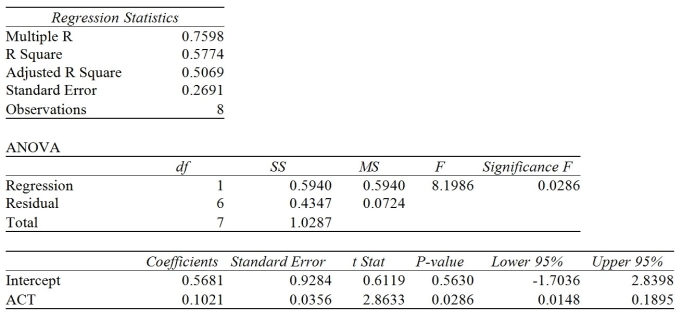
-Referring to Table 12-8, the interpretation of the coefficient of determination in this regression is:
A) 57.74% of the total variation of ACT scores can be explained by GPA.
B) ACT scores account for 57.74% of the total fluctuation in GPA.
C) GPA accounts for 57.74% of the variability of ACT scores.
D) none of the above
Correct Answer:
Verified
Q82: The value of r is always positive.
Q87: The residuals represent
A)the difference between the actual
Q98: TABLE 12-5
The managing partner of an advertising
Q99: TABLE 12-5
The managing partner of an advertising
Q101: Testing for the existence of correlation is
Q102: If the plot of the residuals is
Q110: The sample correlation coefficient between X and
Q112: If the correlation coefficient (r) = 1.00,
Q115: The sample correlation coefficient between X and
Q118: When r = - 1,it indicates a
Unlock this Answer For Free Now!
View this answer and more for free by performing one of the following actions

Scan the QR code to install the App and get 2 free unlocks

Unlock quizzes for free by uploading documents