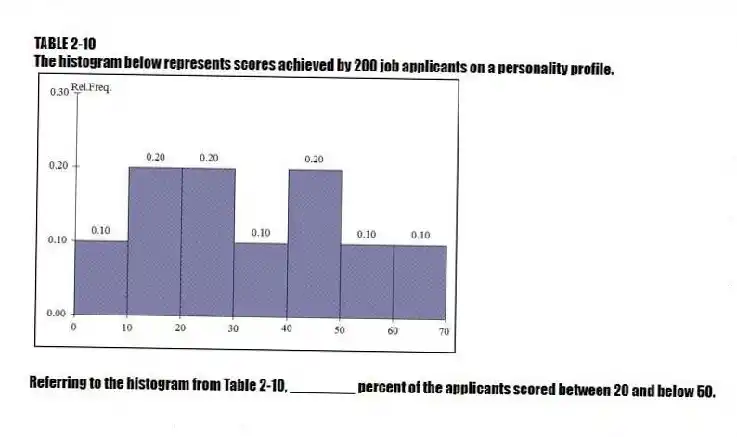
TABLE 2-10
The histogram below represents scores achieved by 200 job applicants on a personality profile.

-Referring to the histogram from Table 2-10, ________ percent of the applicants scored between 20 and below 50.
Correct Answer:
Verified
Q84: When comparing two or more large sets
Q86: TABLE 2-10
The histogram below represents scores achieved
Q87: TABLE 2-11
The ordered array below resulted from
Q89: TABLE 2-10
The histogram below represents scores achieved
Q90: TABLE 2-10
The histogram below represents scores achieved
Q91: A_ is a vertical bar chart in
Q91: TABLE 2-11
The ordered array below resulted from
Q93: TABLE 2-11
The ordered array below resulted from
Q97: In constructing a polygon,each class grouping is
Q99: In order to compare one large set
Unlock this Answer For Free Now!
View this answer and more for free by performing one of the following actions

Scan the QR code to install the App and get 2 free unlocks

Unlock quizzes for free by uploading documents