Figure: Home's Exporting Industry II
The graph shows the effect of a subsidy on a large country. 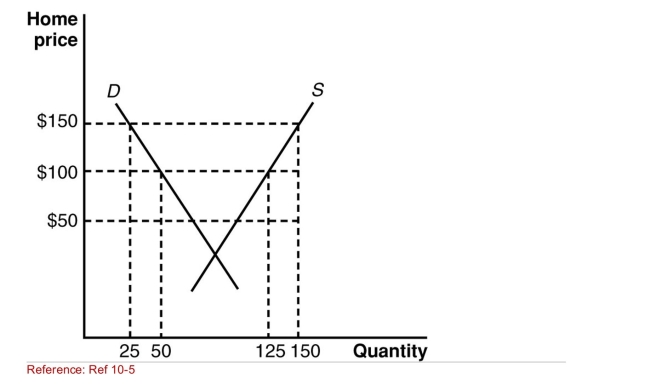
(Figure: Home's Exporting Industry II) According to the
Graph, what happens to the nation's consumer surplus as a
Result of the $100 export subsidy?
A) It increases by $2,500.
B) It decreases by $1,875.
C) It increases by $1,875.
D) It decreases by $2,500.
Correct Answer:
Verified
Q45: SCENARIO: FREEDONIAN EXPORTS
In the small country of
Q46: SCENARIO: FREEDONIAN EXPORTS
In the small country of
Q47: An export subsidy has a similar effect
Q48: Suppose that the world price of sugar
Q49: If a large nation subsidizes its exports,
Q51: Suppose that the world price of sugar
Q52: SCENARIO: FREEDONIAN EXPORTS
In the small country of
Q53: FTihgeu grera:p Hho smhoew'ss Ethxep oerffteinctg o
Q54: What happens to the large country's domestic
Q55: SCENARIO: FREEDONIAN EXPORTS
In the small country of
Unlock this Answer For Free Now!
View this answer and more for free by performing one of the following actions

Scan the QR code to install the App and get 2 free unlocks

Unlock quizzes for free by uploading documents