Multiple Choice
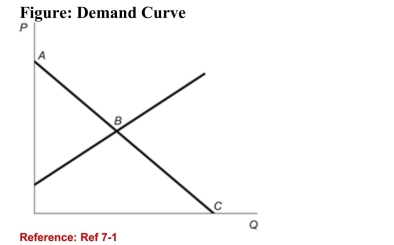 (Figure: Demand Curve) Refer to the figure. Which point onthe graph represents the value of the good in its next highestvalued use?
A) Point A
B) Point B
C) Point C
D) the origin
Correct Answer:
Verified
Related Questions
Q25: The Strike King Lure Co. ordered $100,000
Q26: Suppose that a war in the Middle
Q29: The equilibrium price in the market represents
Q30: The central planning approach proved _ because
Unlock this Answer For Free Now!
View this answer and more for free by performing one of the following actions

Scan the QR code to install the App and get 2 free unlocks

Unlock quizzes for free by uploading documents