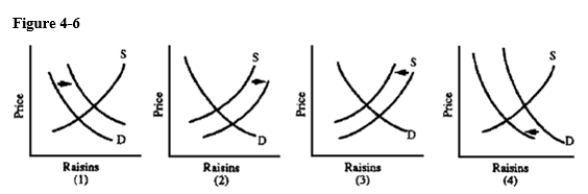
-Grapes can be used to produce wine or raisins.Which graph in Figure 4-6 best depicts the effects on the U.S.raisin market of a decline in purchases of domestic wine?
A) 1
B) 2
C) 3
D) 4
Correct Answer:
Verified
Q196: The law of increasing relative costs, depicted
Q197: When a supply curve is constructed, data
Q198: An upward-sloping supply curve shows that
A)buyers are
Q199: A key assumption made when a supply
Q200: The wage rate.is the price of a
Q202: The supply curve of books (which are
Q203: The quantity of newspapers sold will decline
Q204: Suppose we are considering the milk market
Q205: The price of one good produced by
Q206: The supply curve of books (which are
Unlock this Answer For Free Now!
View this answer and more for free by performing one of the following actions

Scan the QR code to install the App and get 2 free unlocks

Unlock quizzes for free by uploading documents