Figure 11-8 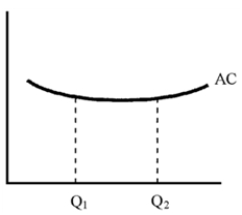
-Consider the average cost curve shown in Figure 11-8, for the production of cleaning.If the firm serves the entire market and sells Q1 units.Based upon this information, the firm is experiencing
A) constant returns to scale .
B) increasing returns to scale.
C) decreasing returns to scale.
D) externalities.
Correct Answer:
Verified
Q180: Figure 11-6 Q181: Figure 11-8 Q182: The monopoly producer Q183: Compared to perfect competition, monopoly in the Q184: Figure 11-9 Q186: Figure 11-9 Q187: Compared to perfect competition, a monopoly in Q188: Under monopoly Q189: Figure 11-7 Q190: Figure 11-9 Unlock this Answer For Free Now! View this answer and more for free by performing one of the following actions Scan the QR code to install the App and get 2 free unlocks Unlock quizzes for free by uploading documents![]()
![]()
A)sets MU equal to P.
B)sets![]()
![]()
A)too small a share of society's![]()
![]()

