Figure 13-2
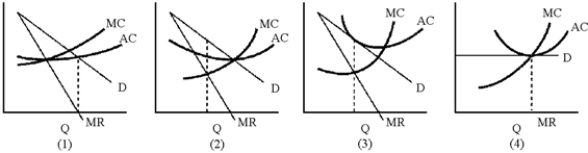
-In Figure 13-2, which of the graphs represents a monopolistic competitor in long-run equilibrium?
A) 1
B) 2
C) 3
D) 4
Correct Answer:
Verified
Q100: Firms in a perfectly contestable market will
Q101: An article in The Economist reported that
Q102: Suppose that a firm in monopolistically competitive
Q103: The demand curve facing a monopolistically competitive
Q104: Monopolistic competition is different from perfect competition
Q106: The demand curve for a monopolistic competitor
Q107: The key difference between monopolistic competition and
Q108: A firm in monopolistically competitive market is
Q109: Figure 13-1 Q110: In the short run, firms in monopolistically
![]()
Unlock this Answer For Free Now!
View this answer and more for free by performing one of the following actions

Scan the QR code to install the App and get 2 free unlocks

Unlock quizzes for free by uploading documents