Figure 36-5
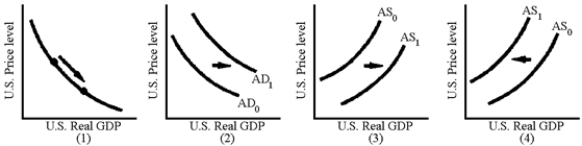
-Which of the graphs in Figure 36-5 are consistent with a depreciation of the U.S.dollar and an increase in net exports caused by a decrease in U.S.interest rates?
A) 1
B) 2
C) 3
D) 4
Correct Answer:
Verified
Q114: A closed economy is one that
A)uses tariffs.
B)uses
Q115: International trade tends to lower the value
Q116: International capital flows are purchases and sales
Q117: Expansionary fiscal policy in an open economy
A)leads
Q118: Because the United States is highly integrated
Q120: Expansionary fiscal policy in an open economy
Q121: Why is fiscal policy less effective in
Q122: Between 1981 and 1986, as the federal
Q123: Did the large U.S.budget deficits in the
Q124: Figure 36-6
![]()
Unlock this Answer For Free Now!
View this answer and more for free by performing one of the following actions

Scan the QR code to install the App and get 2 free unlocks

Unlock quizzes for free by uploading documents