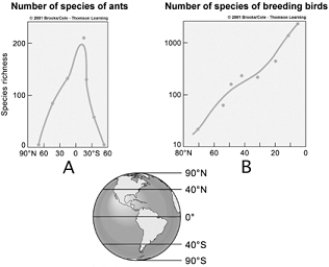
 Use the figure above to answer the following questions.The graphs illustrate diversity patterns for ants (A) and breeding birds (B) .
-Which graph shows that species diversity is much less at the equator than at 60 degrees north latitude?
A) A
B) B
C) both
D) neither
E) not enough data is provided to answer the question
Correct Answer:
Verified
Q29: Graph B shows that breeding bird species
Q30: Q31: Which of the following statements about kudzu Q32: Q32: According to the intermediate disturbance hypothesis,_. Q33: MATCHING Q36: Which of the following is(are) NOT a Q37: MATCHING Q38: MATCHING Q39: A keystone species![]()
![]()
A)
Matching.Choose the most appropriate answer for each.
a.blending
Matching.Choose the most appropriate answer for each.
a.blending
Matching.Choose the most appropriate answer for each.
a.blending
A) has a disproportionately large
Unlock this Answer For Free Now!
View this answer and more for free by performing one of the following actions

Scan the QR code to install the App and get 2 free unlocks

Unlock quizzes for free by uploading documents