Figure 53-3
Use the figure to answer the corresponding question(s) . 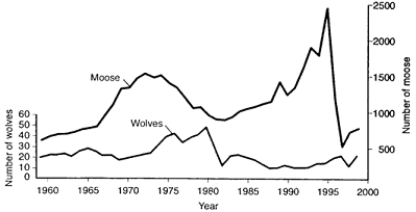
-Based on Figure 53-3, the decline in the moose population in 1996 was most likely due to:
A) a predictable increase in the wolf population.
B) an unpredictable increase in the wolf population.
C) a decrease in the intrinsic rate of increase for the moose population.
D) a decline in the food supply.
E) an unknown disease organism.
Correct Answer:
Verified
Q18: The term referring to the rate at
Q19: The organisms associated with patches of floating
Q20: When r = -0.00057, the population size:
A)
Q21: Figure 53-2
Use the figure to answer the
Q23: An example of a density-dependent factor that
Q24: Which factors would have a greater influence
Q25: Figure 53-4
Use the figure to answer the
Q26: Figure 53-2
Use the figure to answer the
Q27: Pest or weedy species are typically _
Q52: Tawny owls (Strix aluco) pair-bond for life,
Unlock this Answer For Free Now!
View this answer and more for free by performing one of the following actions

Scan the QR code to install the App and get 2 free unlocks

Unlock quizzes for free by uploading documents