Figure 53-1
Use the figure to answer the corresponding question(s) . 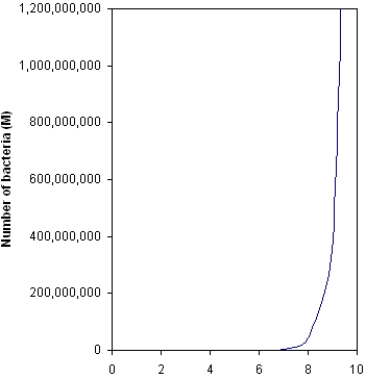
-The graph in Figure 53-1 would best be described as:
A) being characteristic of exponential growth.
B) being characteristic of arithmetic growth.
C) an S-shaped curve.
D) a J-shaped curve.
E) being a J-shaped curve characteristic of exponential growth.
Correct Answer:
Verified
Q3: Which of the following organisms would have
Q3: Clumped dispersion is often influenced by all
Q5: _ is the least frequent of the
Q6: What would be the growth rate (r)
Q11: Which of the following would not increase
Q12: Biologists in which of the following applied
Q12: Which of the following sets of values
Q13: When r = 0.00001, the population size:
A)
Q13: When the size of a population greatly
Q17: Which of the following consists of organisms,
Unlock this Answer For Free Now!
View this answer and more for free by performing one of the following actions

Scan the QR code to install the App and get 2 free unlocks

Unlock quizzes for free by uploading documents