Solve the problem.
-Some of the results of an analysis, on the makeup of garbage, are given in the following table. The table displays various years which gives the number of pounds per person per day of various types of waste materials.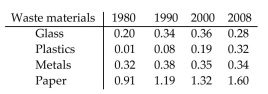
For paper, calculate the average rates of change between consecutive data points in the table. Interpret the meani your results.
A) The rate of increase slows down during the 1980's, but then increases during the 1990's and 2000-2008.
B) The rate of increase slows down during the 1990's, but then increases during 2000-2008.
C) The rate of increase increases during the 1990 's, but then decreases during 2000-2008.
D) The rate of increase stays the same from the 1980's through 2000-2008.
Correct Answer:
Verified
Q12: Match the numerical model to the
Q13: Solve the problem.
-The following data set
Q14: Match the numerical model to the
Q15: Match the numerical model to the
Q16: Solve the problem.
-A rock is thrown
Q18: Match the numerical model to the
Q19: Match the numerical model to the
Q20: Solve the problem.
-The following information pertains to
Q21: Solve the equation algebraically.
-
Q22: Solve the problem.
-The following information pertains to
Unlock this Answer For Free Now!
View this answer and more for free by performing one of the following actions

Scan the QR code to install the App and get 2 free unlocks

Unlock quizzes for free by uploading documents