Identify the following as an experiment or an observational study.
-The correlation coefficient for the data shown in the scatter plot is close to -1 so the slope of the regression equation that goes through the points will be close to -1.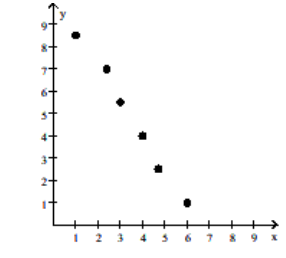
Correct Answer:
Verified
View Answer
Unlock this answer now
Get Access to more Verified Answers free of charge
Q118: Solve the problem.
-The table shows the total
Q119: Solve the problem.
-On a multiple choice test
Q120: Solve the problem.
-On a multiple choice test
Q121: Find the z-score(s) bounding the region in
Q122: Solve the problem.
-A physical fitness association is
Q124: Find the normal probability using a grapher.
-P(-1.5
Q125: Identify the following as an experiment or
Q126: Find the z-score(s) bounding the region in
Q127: Find the normal probability using a grapher.
-P(1.5
Q128: Find the z-score(s) bounding the region in
Unlock this Answer For Free Now!
View this answer and more for free by performing one of the following actions

Scan the QR code to install the App and get 2 free unlocks

Unlock quizzes for free by uploading documents