Solve the problem.
-The table shows the total amount of precipitation (in inches) in a certain US city in 16 different years. Find the range. 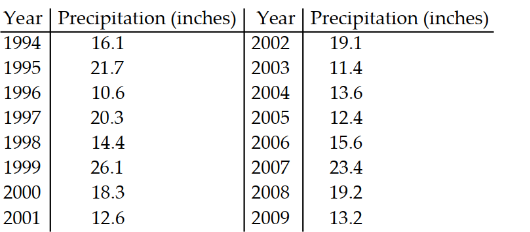
A) 12 in.
B) 12.8 in.
C) 15.5 in.
D) 14.7 in.
Correct Answer:
Verified
Q91: Find the mean. Round to the nearest
Q92: Find the median for the given sample
Q93: Determine the five-number summary of the given
Q94: Find the weighted average.
-Michael gets test grades
Q95: Find the weighted average.
-The table shows the
Q97: Determine the five-number summary of the given
Q98: Determine the five-number summary of the given
Q99: Find the mean. Round to the nearest
Q100: Determine the five-number summary of the given
Q101: Find the normal probability using a grapher.
-P(z
Unlock this Answer For Free Now!
View this answer and more for free by performing one of the following actions

Scan the QR code to install the App and get 2 free unlocks

Unlock quizzes for free by uploading documents