Describe the shape of the distribution.
-A stemplot is given below for the annual precipitation in one U.S. city for 28 consecutive years. Precipitation data are in inches.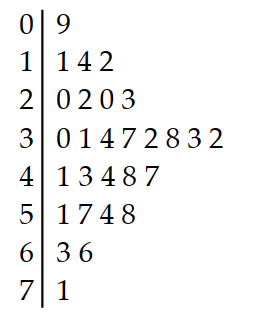
A) Left skewed, unimodal
B) Right skewed, unimodal
C) Symmetric, unimodal
D) Bimodal
Correct Answer:
Verified
Q40: Eleven dimes dated 1989 through 1999 are
Q41: Eleven dimes dated 1989 through 1999 are
Q42: Identify whether the average described is a
Q43: Identify whether the number described is a
Q44: Identify whether the number described is a
Q46: Identify whether the number described is a
Q47: Eleven dimes dated 1989 through 1999 are
Q48: Identify whether the number described is a
Q49: Describe the shape of the distribution.
-A histogram
Q50: Identify whether the average described is a
Unlock this Answer For Free Now!
View this answer and more for free by performing one of the following actions

Scan the QR code to install the App and get 2 free unlocks

Unlock quizzes for free by uploading documents