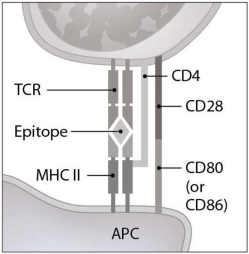
 Figure 16.2 illustrates an interaction between a(n)
A) antigen presenting cell and a B lymphocyte.
B) antigen presenting cell and a T lymphocyte.
C) NK cell and its target cell.
D) CTL and its target cell.
E) antigen presenting cell and a plasma cell.
Correct Answer:
Verified
Q28: Exogenous antigens are processed for immune recognition
Q29: The perforin-granzyme pathway involves
A) the production of
Q30: Which of the following cytokines promotes the
Q31: Which of the following is true of
Q32: What is the role of interleukins?
A) chemotaxis
Q34: What type of immunity is produced by
Q35: Class II MHC are found on
A) the
Q36: Which of the following statements regarding the
Q37: Which of the following statements concerning plasma
Q38: Major histocompatibility antigens are
A) antigens that provoke
Unlock this Answer For Free Now!
View this answer and more for free by performing one of the following actions

Scan the QR code to install the App and get 2 free unlocks

Unlock quizzes for free by uploading documents