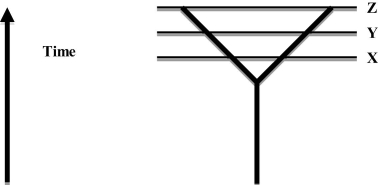
 The diagram represents the splitting of one population into two separate lineages that become more different over time (the distance between the two lines represents the amount of difference between the two lineages) . Which of the following statements about the two lineages is most accurate?
A) They are more likely to be separate species at time Z than at time X.
B) They are likely to be more different at time X than at time Z.
C) They are more likely to fuse if they start interbreeding at time Z than at time X.
D) There are likely to be more isolating mechanisms at time X than at time Z.
Correct Answer:
Verified
Q8: If biological species are defined in terms
Q9: The common edible frog of Europe is
Q10: Two juniper trees (Juniperus scopulorum and J.
Q11: Which of the following statements best describes
Q12: Which of the following characteristics are demonstrated
Q14: Which of the following provides an example
Q15: Which of the various species concepts distinguishes
Q16: Lions and tigers sometimes breed in zoos,
Q17: Recently, a museum scientist discovered a case
Q18: Which of the following characteristics is a
Unlock this Answer For Free Now!
View this answer and more for free by performing one of the following actions

Scan the QR code to install the App and get 2 free unlocks

Unlock quizzes for free by uploading documents