Which of the following graphs best illustrates the growth curve of a small population of rodents that has increased to a static carrying capacity?
A) 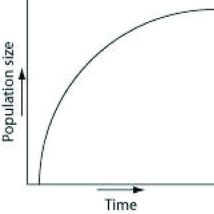
B) 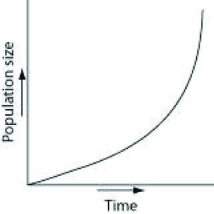
C) 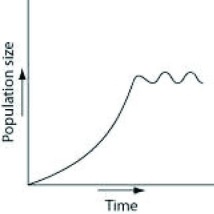
D) 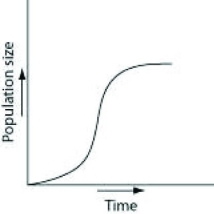
Correct Answer:
Verified
Q24: In April 2019, the population in the
Q25: A species population's size (N) may vary
Q26: A population of ground squirrels has an
Q27: Which of the following causes populations to
Q28: An undergraduate student is working in a
Q30: In 2019, the United States Census Bureau
Q31: A researcher is studying two old-growth forests
Q32: In 2019, the United States Census Bureau
Q33: In 2019, the United States Census Bureau
Q34: Starting from a single individual, which estimate
Unlock this Answer For Free Now!
View this answer and more for free by performing one of the following actions

Scan the QR code to install the App and get 2 free unlocks

Unlock quizzes for free by uploading documents