Use the graph to answer the following question. 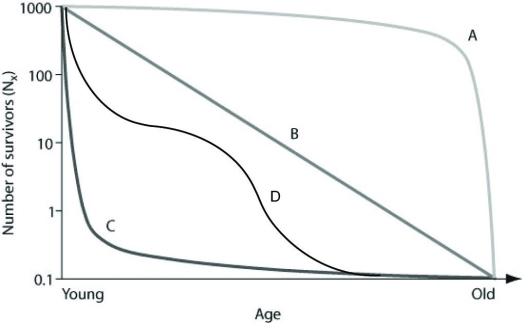 In the figure, which of the following survivorship curves is most consistent with humans who are living in developed countries where most of the population has consistent access to resources such as food, water, shelter and health care?
A) curve A
B) curve B
C) curve C
D) curve D
Correct Answer:
Verified
Q9: Use the graph to answer the following
Q10: Use the table to answer the following
Q11: Which of the following is a critical
Q12: Use the hypothetical or idealized survivorship curves
Q13: Which of the following species is most
Q15: Use the hypothetical or idealized survivorship curves
Q16: Use the table to answer the following
Q17: Researchers marked 800 turtles in a population,
Q18: Use the table to answer the following
Q19: Which of the following assumptions is applied
Unlock this Answer For Free Now!
View this answer and more for free by performing one of the following actions

Scan the QR code to install the App and get 2 free unlocks

Unlock quizzes for free by uploading documents