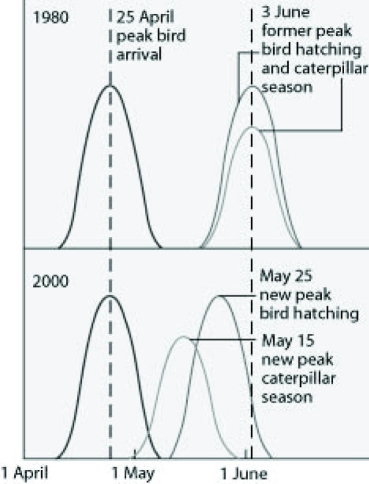
Use the following graph and information to answer the question.
Flycatcher birds that migrate from Africa to Europe feed their chicks a diet that is almost exclusively moth caterpillars. The graph shows the peak dates of flycatcher arrival in Europe, bird hatching, and peak caterpillar season for the years 1980 and 2000. The y-axis is a measure of the abundance of birds, hatching chicks, and caterpillars. 
The shift in the peak of caterpillar season is most likely due to ________.
A) earlier migration returns of flycatchers
B) an innate change in the biological clock of the caterpillars
C) global climate change
D) acid precipitation in Europe
Correct Answer:
Verified
Q46: Which of the following is the most
Q47: Which of the following habitats would most
Q48: Which of the following statements is supported
Q49: During the inventory of bacterial genes present
Q50: Which of the following best describes the
Q52: Which of the following is an accurate
Q53: Human-generated microplastics have thus been detected in
Q54: Which of the following outcomes is caused
Q55: Which of the following best describes a
Q56: Your friend is wary of environmentalists' claims
Unlock this Answer For Free Now!
View this answer and more for free by performing one of the following actions

Scan the QR code to install the App and get 2 free unlocks

Unlock quizzes for free by uploading documents