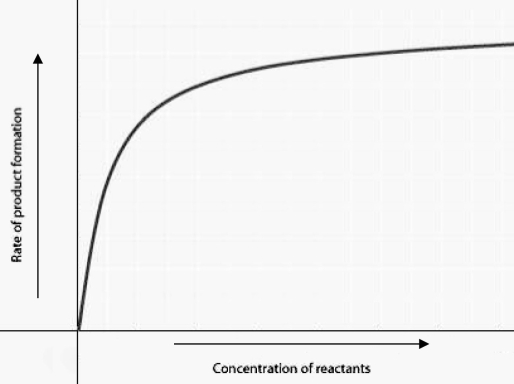
 The figure displays the relationship between initial rate of product formation and reactant concentration in an enzyme-catalyzed reaction with a fixed amount of enzyme. Which of the following statements best explains the shape of the rate curve at high reactant concentration?
A) Feedback inhibition by product occurs at high reactant concentrations.
B) Most enzyme molecules are occupied by substrate at high reactant concentrations.
C) The reaction nears equilibrium at high reactant concentrations.
D) The rate of the reverse reaction increases at high reactant concentrations.
Correct Answer:
Verified
Q44: Students conducting research observe the rate of
Q45: Disruption of the active site of an
Q46: Penicillin is an antibiotic that kills bacteria
Q47: In the citric acid cycle, succinate dehydrogenase
Q48: A series of enzymes catalyze the reactions
Q50: Zinc is an essential trace element for
Q51: Use the following information to answer the
Q52: The 3-D structure of an enzyme composed
Q53: In addition to activating or inhibiting enzymes
Q54: A series of enzymes catalyze the reactions
Unlock this Answer For Free Now!
View this answer and more for free by performing one of the following actions

Scan the QR code to install the App and get 2 free unlocks

Unlock quizzes for free by uploading documents