The following graphs show the frequency of the b+ allele over 20 generations in two populations of heterozygous flour beetles (data for a population of 10 individuals is shown in graph A; data for a population of 100 individuals is shown in graph B) . Why does the frequency of the b+ allele increase in both populations? 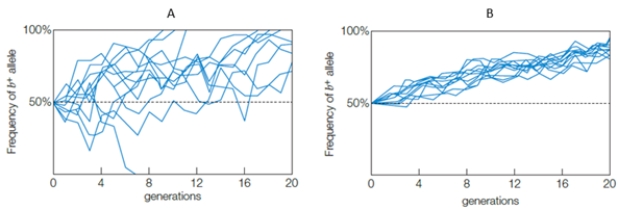
A) b+ is a lethal allele.
B) b+ is a balanced polymorphism.
C) b+ is a fixed allele.
D) b+ allele is adaptive.
E) b+ is a neutral mutation.
Correct Answer:
Verified
Q24: In a tropical forest, some leaves are
Q25: Which population is more likely to be
Q26: The movement of alleles among populations is
Q27: In Cameroon, seedcrackers have either small bills
Q28: The Old Order Amish in Lancaster County
Q30: A small Dutch population settled in South
Q31: In the universal ABO blood grouping system,
Q32: Many male birds will expend a great
Q33: Heterozygotes for the sickle cell trait have
Q34: Puppies born too large experience difficulties during
Unlock this Answer For Free Now!
View this answer and more for free by performing one of the following actions

Scan the QR code to install the App and get 2 free unlocks

Unlock quizzes for free by uploading documents