Multiple Choice
A graph of 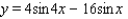 for
for  is shown in the figure. Find the exact values of the x-intercepts.
A) 
B) 
C) 
D) 
E) 
Correct Answer:
Verified
Related Questions
Q12: Find the solutions of the equation that
Q13: Verify the identity. Q14: Verify the identity. Q15: Verify the identity. Q16: Find all solutions of the equation. Q18: Find the identity for the function. Q19: Find the exact values of Q20: Verify the identity. Q21: The average monthly high temperature T (in Q22: Find the exact value of the expression. Unlock this Answer For Free Now! View this answer and more for free by performing one of the following actions Scan the QR code to install the App and get 2 free unlocks Unlock quizzes for free by uploading documents![]()
![]()
![]()

![]()

