Multiple Choice
A graph of 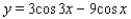 for
for  is shown in the figure. Find the exact values of the x-intercepts.
A) 
B) 
C) 
D) 
E) 
Correct Answer:
Verified
Related Questions
Q6: Tell whether the reduction formula is correct
Q7: On a cloudy day with D hours
Q8: Verify the identity. Q9: Verify the identity. Q10: The average monthly high temperature T (in Q12: Find the solutions of the equation that![]()
![]()

