The line graph shows the costs of a 30-second television spot (in thousands of dollars) during the Super Bowl from 1995 to 2005. 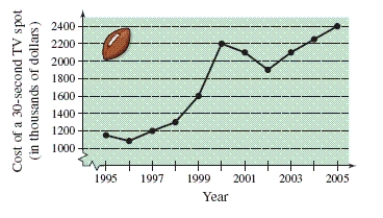 Estimate the increase in the cost of a 30-second spot from the Super Bowl in 1998 to the Super Bowl in 2002.
A) 1080 thousand dollars
B) 1200 thousand dollars
C) 300 thousand dollars
D) 900 thousand dollars
E) 600 thousand dollars
Correct Answer:
Verified
Q46: Factor the expression by removing the common
Q47: Evaluate the expression. Q48: Perform the subtraction and simplify. Q49: Simplify the complex fraction. Q52: Identify the rule of algebra illustrated by Q53: Evaluate the expression. Q54: Determine which numbers in the set are Q55: Completely factor the expression. Q56: Perform the division and simplify. Q60: Find the distance between the points. Round Unlock this Answer For Free Now! View this answer and more for free by performing one of the following actions Scan the QR code to install the App and get 2 free unlocks Unlock quizzes for free by uploading documents![]()

![]()
![]()
![]()

