Multiple Choice
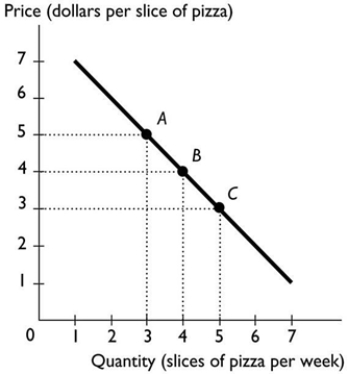
-The above figure shows the relationship between the price of a slice of pizza and how many slices of pizza Ricardo buys in a week. Between points A and B, the slope of the line equals
A) -4.
B) -2
C) -3.
D) -1.
E) -5.
Correct Answer:
Verified
Related Questions

