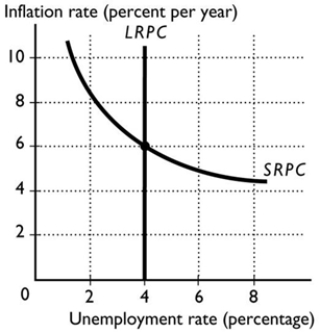
-In the figure above, the expected inflation rate is
A) 0 per cent.
B) 4 per cent.
C) 6 per cent.
D) 2 per cent.
E) 8 per cent.
Correct Answer:
Verified
Q31: The long-run Phillips curve indicates that
A) any
Q32: When the aggregate demand curve shifts rightward,
Q33: In the short run, a decrease in
Q34: The short-run Phillips curve shows only a
Q35: If the economy is at full employment,
Q37: Data from the United States and the
Q38: The long-run Phillips curve applies when the
Q39: The lack of a long-run tradeoff between
Q40: The long-run Phillips curve shows the relationship
Q41: ![]()
Unlock this Answer For Free Now!
View this answer and more for free by performing one of the following actions

Scan the QR code to install the App and get 2 free unlocks

Unlock quizzes for free by uploading documents