Multiple Choice
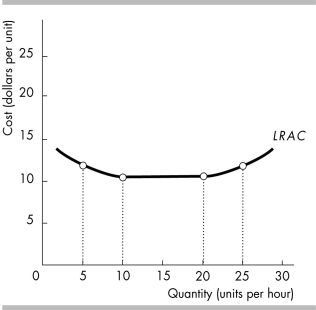
-In the above figure, the long-run average cost curve exhibits constant returns to scale
A) between 5 and 10 units per hour.
B) between 10 and 20 units per hour.
C) between 20 and 25 units per hour.
D) along the entire curve.
Correct Answer:
Verified
Related Questions

