Multiple Choice
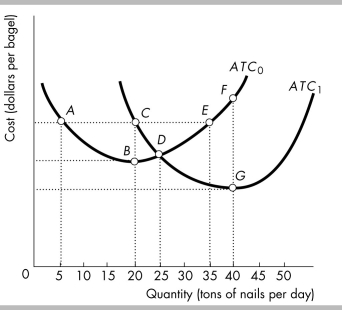
-The average total cost curves for Plant 1, ATC0, and Plant 2, ATC1, are shown in the figure above. The long-run average cost curve goes through points
A) C, D, G.
B) A, C, E.
C) A, B, D, G.
D) A, B, D, E, F.
Correct Answer:
Verified
Related Questions

