Multiple Choice
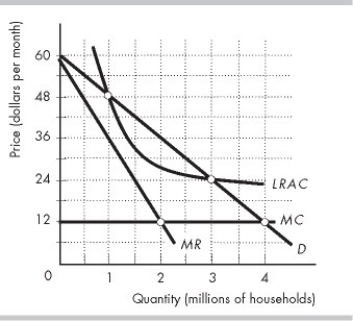
-The figure above shows the demand curve (D) faced by Visual, Inc., a cable TV company, and the firm's marginal revenue (MR) , marginal cost (MC) , and average cost (LRAC) curves. Suppose Visual is regulated according to a price cap rule, with the price cap set at $24 per household per month. The firm will maximize its profit if it serves ________ million households.
A) 2
B) 2.5
C) 3
D) 3.5
Correct Answer:
Verified
Related Questions

