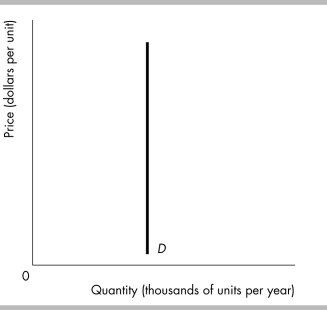
-The above figure illustrates the demand curve for a good. The good has
A) no substitutes.
B) only one substitute.
C) only a few substitutes.
D) many substitutes.
Correct Answer:
Verified
Q247: The cross elasticity of demand is calculated
Q248: Q249: Toothpaste and toothbrushes are complements, so the Q250: If the price elasticity of demand for Q251: Moving up (to the left) along a Q253: The cross elasticity of demand measures the Q254: Blue pens and black pens are close Q255: If the cross elasticity of demand between Q256: A rise in the price of a Q257: When the price of a hot dog![]()
Unlock this Answer For Free Now!
View this answer and more for free by performing one of the following actions

Scan the QR code to install the App and get 2 free unlocks

Unlock quizzes for free by uploading documents