Multiple Choice
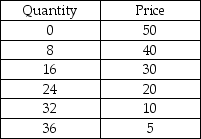
-If we use the numbers in the above table to draw a graph, with the price on the vertical axis and the quantity on the horizontal axis, the line relating price and quantity has a slope of
A) 0.8.
B) -8.0.
C) -1.25.
D) 8.0.
Correct Answer:
Verified
Related Questions

