Multiple Choice
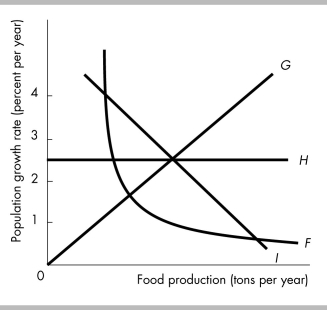
-In the above figure, which curve indicates that the level of food production does not affect the population growth rate?
A) F
B) G
C) H
D) I
Correct Answer:
Verified
Related Questions
Q353: The slope of a line
A) can never
Q354: The relationship in the above figure suggests
Q355: Q356: Suppose we are considering the relationship between Q357: The slope of a line equals the Q359: If a large change in the variable Q360: Suppose we are considering the relationship between Q361: In a graph, a line has a![]()
A)
Unlock this Answer For Free Now!
View this answer and more for free by performing one of the following actions

Scan the QR code to install the App and get 2 free unlocks

Unlock quizzes for free by uploading documents